Monitoring, ticketing, alerting and reporting for solar installations
Nieuw!
Solar Monitoring & Management Summit
Gent - 17 Oktober 2023
Overarching monitoring
for solar installations
Besides visualization and data storage of measurements, technical, maintenance and financiel analysis' are also available with this platform.


... and more integrations!
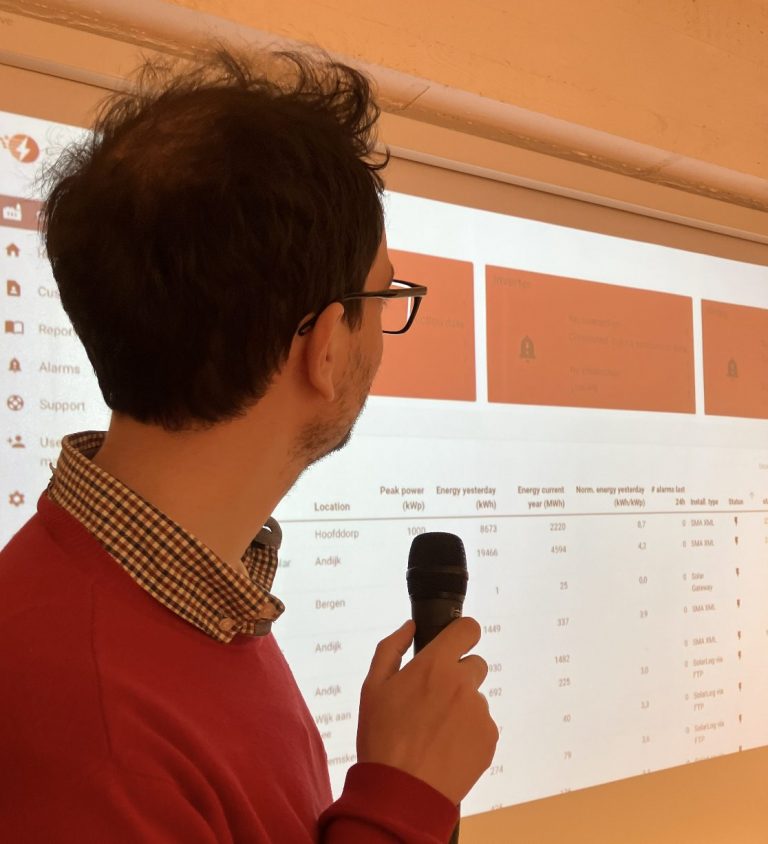
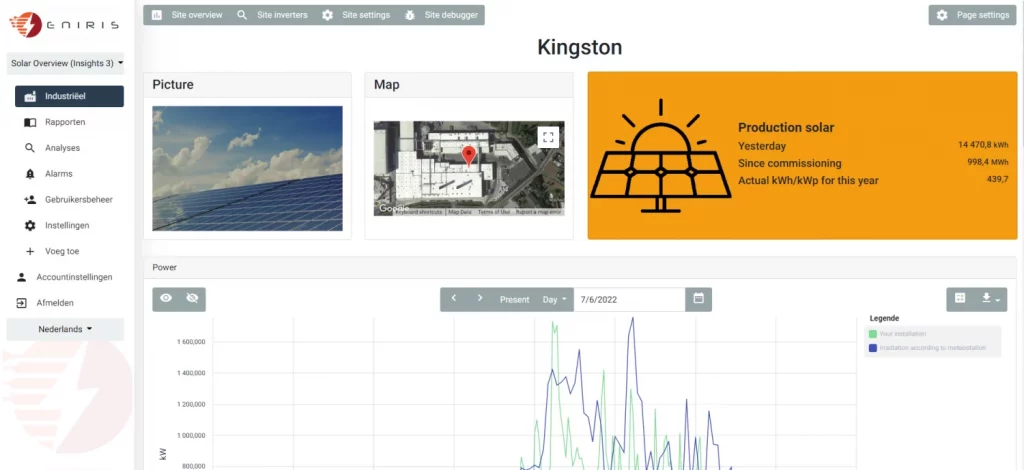
Manage and guard your installations through a single platform
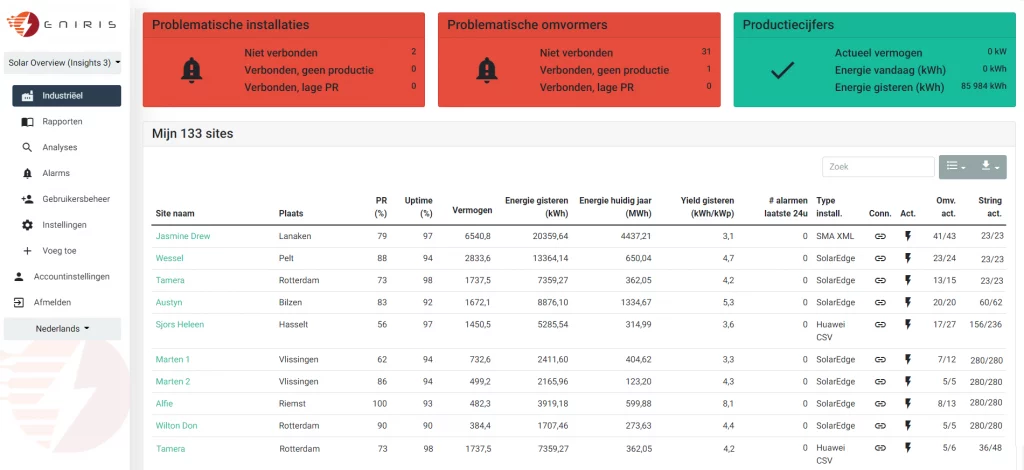
View the most important performance of all your solar installations.
- Performance ratio (PR), Yield, Uptime / downtime
- Number of inverters active / faulty / offline
- Energy: consumption, production, normalized, simulation
- Income rate
- Irradiation
- Precipitation & precipitation probability, air pressure, snowfall, temperature, wind direction and speed
- Voltage, current, cos phi
Meteodata
Acces to realtime temperature, irradiation and production forecasts.
- For correct calculations of the performance ratio (PR)
- Usage-forecasts based on temperature-forecasts

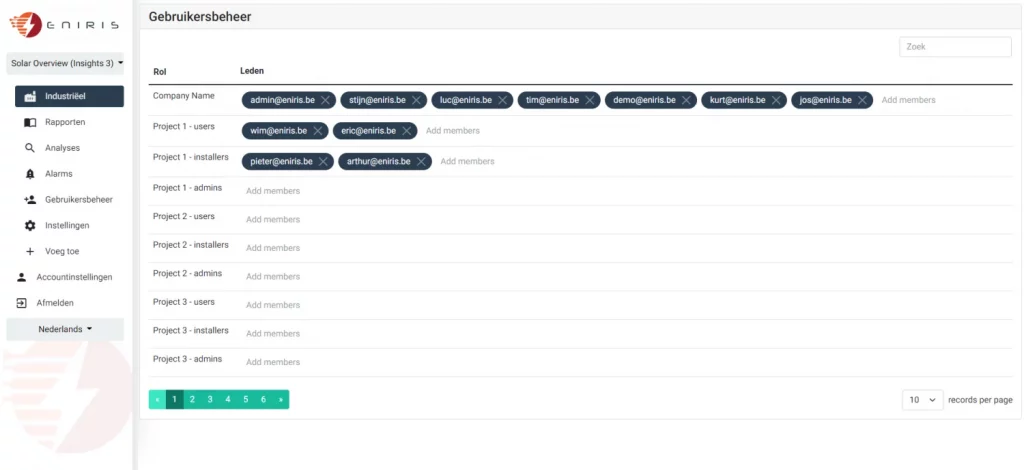
Your customer portal
Your customer portal, which can help foster long-term customer loyalty.
- Easy user management
- Multi level user management
- Customer records
- Access to various measurement systems from one portal
- Access to all consumption reports and financial analyses.
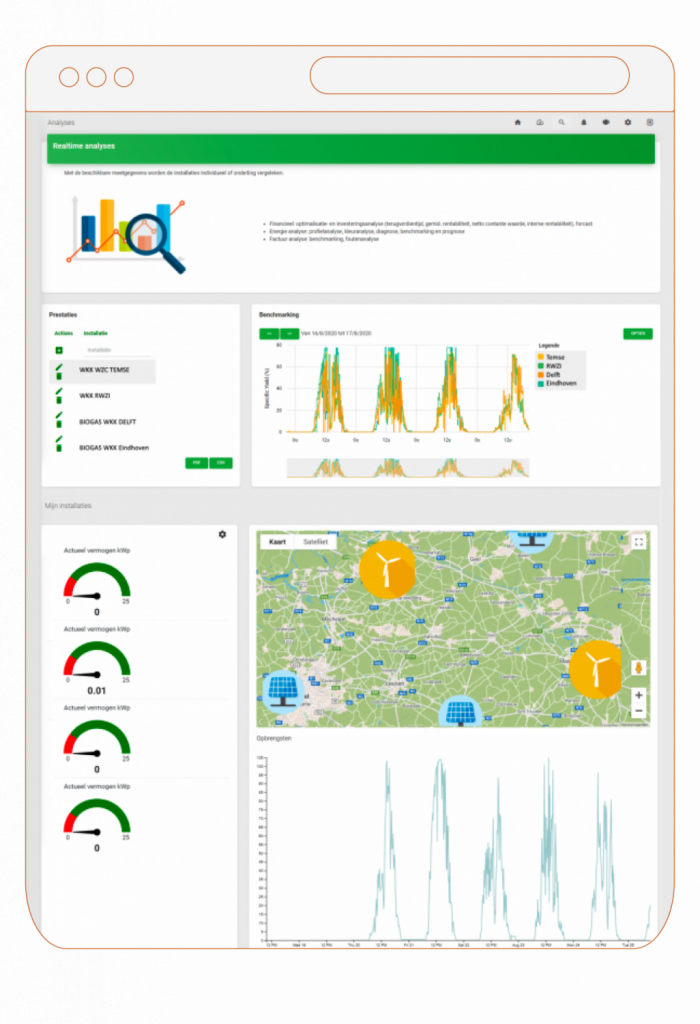
All installations mapped out
Detecting problems in your portfolio is particularly easy via the clear map view.
- Various filters: new installations, installations with critical alarms, disconnected installations…
- Immediately acces your preferred installation.

Grouped view
Combine various installations and bundle them on one page.
- Leave notes for your employees or customer.
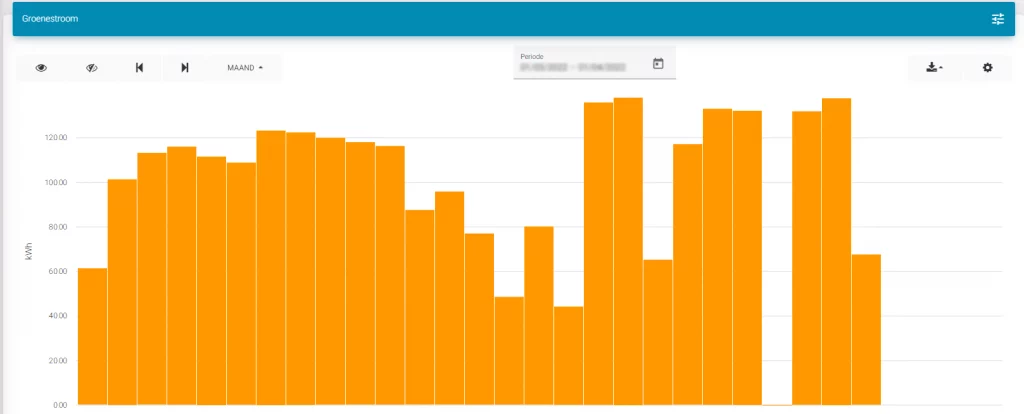
- Visualize the effective energy production registered by the gross production meter (BPM)
- Visualize theoretical energy production based on meteorological data.
- The energy consumption recorded by your energy meters
Indispensable analyses
Be it a brief visual check or a detailed comparison, Eniris Solar provides you with the helpful tools.
- Compare sensors, energy meters, inverters, strings, ...
- Various visualizations (heatmap, pie charts, bar charts…)

Alarm management and ticketing
Set alarm thresholds independently of the underlying control systems.
- Overarching registration and processing.
- Assigning various priorities per alarm.
- Forward alarms by mail, popup (option) or SMS (option)
- Integration with your ERP system and digital work orders
- Ticketing within Eniris Solar

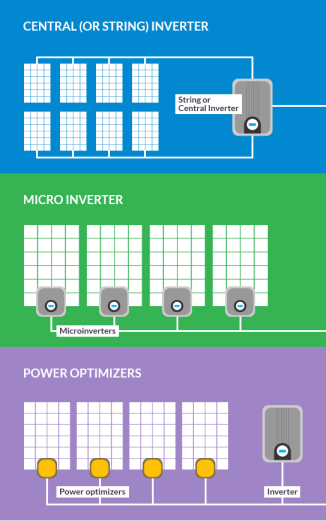
Gross production meter
Reading data of the GPM.
Details of string, optimizer or (micro) inverters.
Details of string, optimizer or (micro) inverters. The following devices are able to be monitored as well:
- Pyranometers
- Battery system
- Anti-injectiesysteem
- Gross production meter
- Sustainable energy meter
- EV Charging Stations
- Heatpumps
- Energy meters
Personalised dashboard
The platform completely according to your corporate identity and part of your ecosystem.
- Your own logos
- Accessible via your URL
- Colour scheme according to your corporate identity

Reporting for you and
your customer
We develop various templates:
- Usage reports
- Production reports
- Financial reporting
- Internal or external rapport
- Group reporting (combination of different installations)
Infographics
Share energy performance with your audience through our infographic controller.
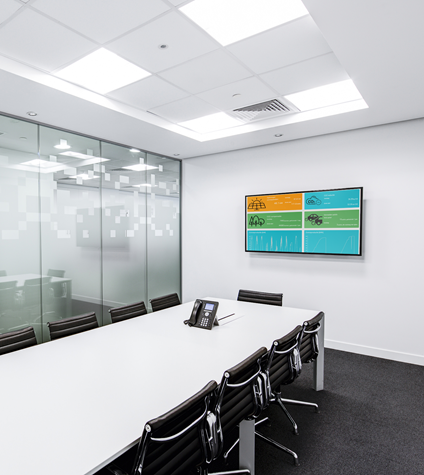
For large displays
Infographics display usage and production data in a visual matter for (big) screens. Showing real-time performance such as:
- CO2 reduction
- Savings Measures
- Actual production
- …
Instantly centralize everything in no time
Start with a minimum of input. We only require a guest account of the portals of the inverters you want to monitor.
Solar Gateway
A single gateway for all inverters
Met Eniris Solar kunt u omvormers inlezen zonder extra hardware indien deze op een platform zijn aangesloten (b.v. Sunny Portal). Via de achterliggende API halen wij de data & alarmen op.
If inverters don't posses an online platform or functionality for data export, reading out data can be made possible using the Eniris Solar Gateway.
Brand-independent
The Solar Gateway is compatible with many devices thanks to the RS422 or RS232 MODBUS interface.
It couldn't be simpler
The Solar Gateway is plug-and-play and instantly connected to the right portal. For industrial installations there's a DIN-rail version.