eniris.be

Infographics & narrowcasting solutions

Software & hardware solutions for displaying performance and energy data.

Infographics

Incase you require a ready-made solution for narrowcasting, our infographic controller is the solution of choice.

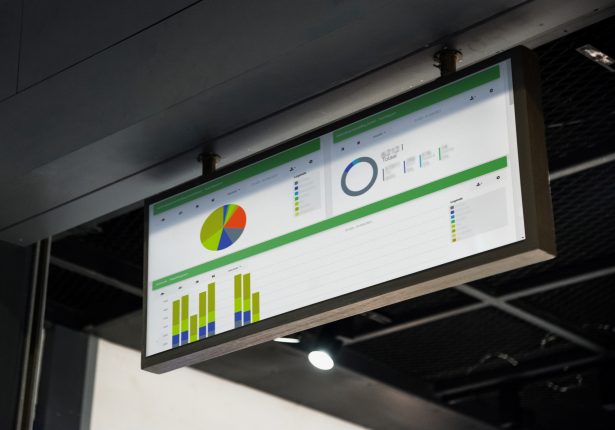
With the infographic controller we're able to easily display energy data (energy production, usage, water usage or a production-process / scheme) visually on a TV-display. Our connect our infographic controller with any screen of your choosing through HDMI.

The data can be sent locally though various communication protocols, or monitored remotely through Eniris Insights. 

Examples

Background images, lay-out, colors & content can easily be adjusted to your preferences.

Unique selling points

At a glance

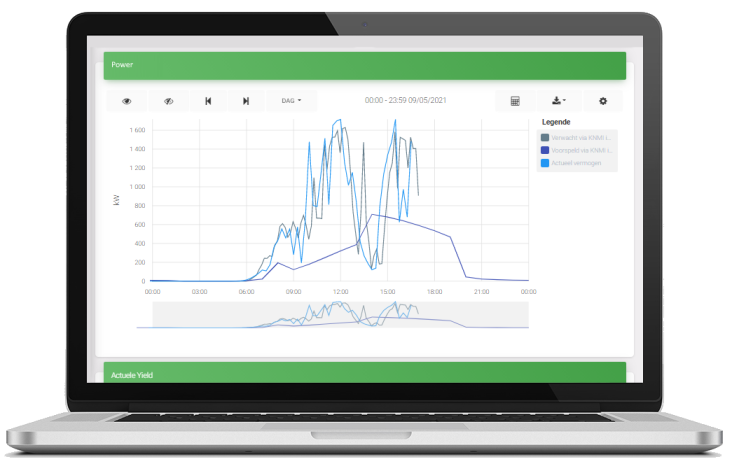
View the most important performance of all your solar installations.
All Key Performance Indicator's (KPI's) in a row
  • Performance ratio (PR)
  • Yield
  • Uptime / downtime
  • Number of inverters active / faulty / offline
  • Free to choose ratio's
  • Availability
  • Energy: consumption, production, normalized, simulation
  • Energy Performance Index
  • Installed assets DC
  • Generation
  • Irradiation
  • Precipitation and forecast
  • Airpressure
  • Snow
  • Rates
  • Temperature
  • Wind speed and direction
  • Voltage, current, cos phi
Meteodata
The actual weather report for every location. Especially: duration of daylight time, global radiation and a 4-day sun forecast.
Quality criterion for your PV-installations
  • For correct calculations of the performance ratio (PR)
  • Production forecast based on radiation forecast
User Management
Giving acces was never this easy.
Your customer portal

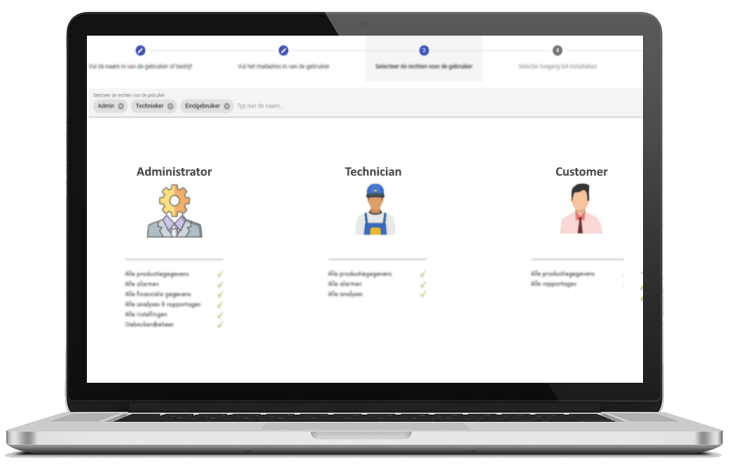
Met Solar Supervision kunt u op een gebruiksvriendelijke manier klanten, techniekers of administratoren toevoegen en beheren. Voor ieder type gebruiker is zijn er aparte niveau’s waarop data kan worden geraadpleegd.
  • Eindelijk toegang tot diverse omvormermerken vanuit één portaal (b.v. u kunt een SMA & Huawei installatie bundelen).
  • Toegang tot alle productierapporten of financiële analyses.
  •  
Rapportage
Op maat van elk type gebruiker.
Bye bye spreadsheets
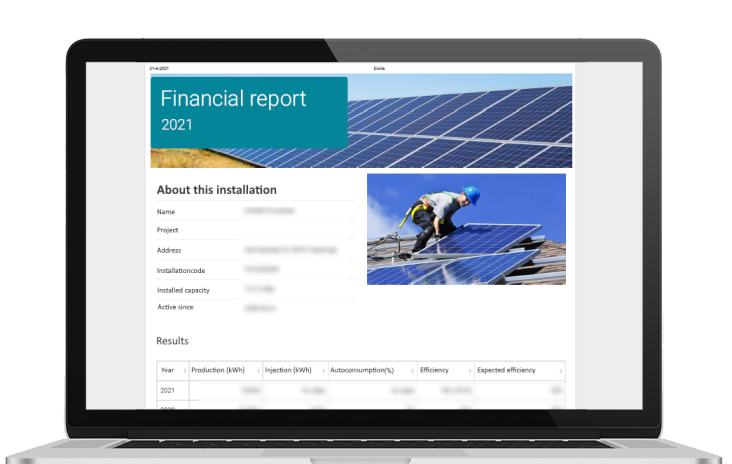
We ontwikkelen gepersonaliseerde sjablonen waarin we de productie- of financiële cijfers verwerken.
  • Opbrengsten rapportage
  • Financial reporting
  • Internal or external rapport
  • Group reporting (combination of different installations)
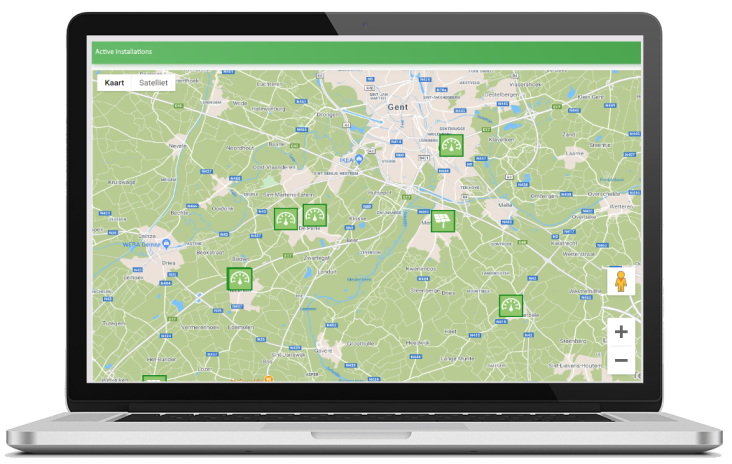
All installations mapped out
Detecting problems in your portfolio is particularly easy via the clear map view.
Interactieve live kaart
  • Diverse filters: nieuwe installaties, installaties met kritiek alarm, gedeconnecteerde installaties…
  • Meteen doorklikken naar het gewenste profiel.
White-label

Wijzig de branding van Solar Supervision volledig naar de branding van uw merk.
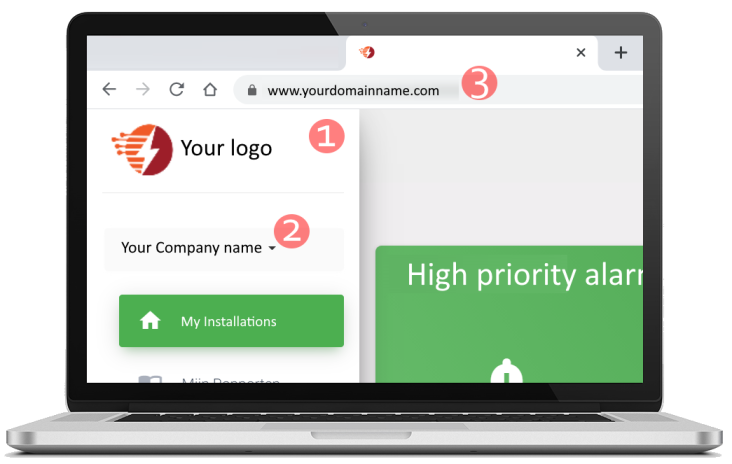
Versterk uw branding
The platform completely according to your corporate identity and part of your ecosystem.
  • Uw eigen logo’s
  • Bereikbaar via uw eigen URL
  • Colour scheme according to your corporate identity
Indispensable analyses

Of het nu een kortstondig visuele check is of een gedetailleerd vergelijk, Solar Supervision levert u de behulpzame tools.
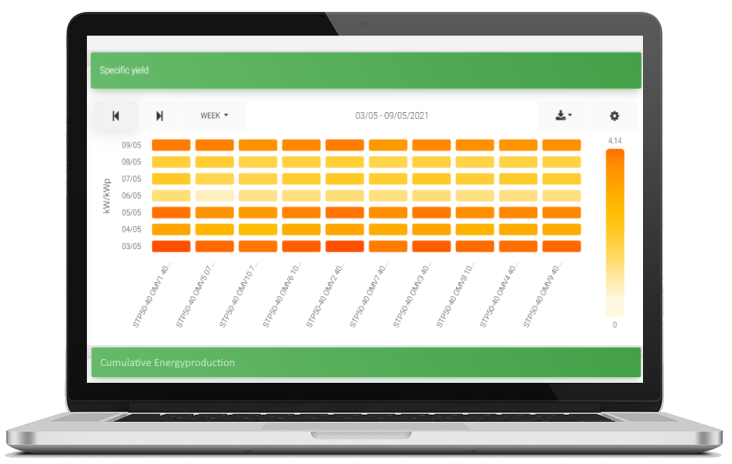
Van data-analyse tot beslissing
  • Vergelijk op string- & omvormerniveau.
  • Vergelijk sensoren & energiemeters.
  • Financiële, onderhouds & technische analyse.
  • Diverse visualisaties (heatmap, piecharts, barcharts, scatter plot…).
Grouped view

Combineer omvormers van diverse merken en giet ze in één gegroepeerde pagina voor dezelfde plant.
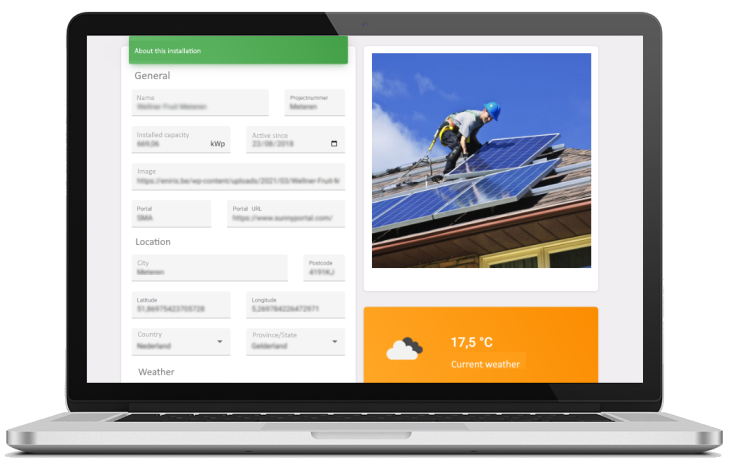
Uniforme installatiepagina’s
  • Laat notities achter voor uw personeel of eindklant.
  • Visualiseer het energieverbruik geregistreerd door de energiemeters.
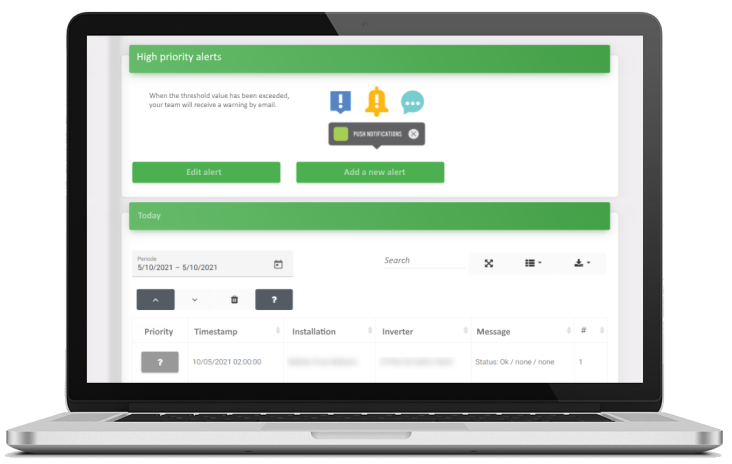
Alarmmanagement en ticketing
Stel zelf alarmdrempels in, onafhankelijk van de onderliggende portalen.
Meer rendement uit uw alarmverwerking
  • Overarching registration and processing
  • Assigning various priorities
  • Forward alarms by mail, popup or SMS (option)
  • Integration with your ERP system and digital work orders
  • Ticketing
  •  

A single gateway for all inverters

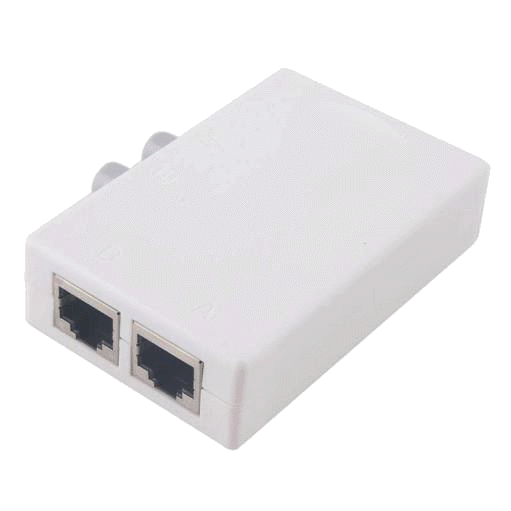
Solar Gateway

Solar Supervision allows you to read inverters without additional hardware if they are connected to a platform (e.g. Sunny Portal). Via the underlying API, we retrieve the data & alarms.


If inverters don't posses an online platform or functionality for data export, reading out data can be made possible using the Eniris Solar Gateway.

Brand-independent

The Solar Gateway is compatible with many devices thanks to the RS422 or RS232 MODBUS interface.

It couldn't be simpler

The Solar Gateway is plug-and-play and instantly connected to the right portal. For industrial installations there's a DIN-rail version.
Webinars

Play Video

Oktober 2021

Webinar PV monitoring

Met Eniris hebben we een overkoepelend monitoringsportaal ontwikkeld voor de opvolging van zonneproductie.

Contact us

Book a meeting

Bart Verheecke

bart@eniris.be
+32 (0) 494 10 70 47
+31 (0) 613 42 82 15

Subscribe to our newsletter

Schrijf u in op nieuwsbrief als u op de hoogte wenst gehouden te worden over onze projecten, ons bedrijf of onze industrie.